
How to Read Stock Charts [2025] Reading Stock Chart for Beginners
Investing in the stock market is one of the most popular ways to grow your wealth. In fact, 61% of American adults invested in the stock market in 2023. Stock charts are a helpful resource for anyone making investment decisions. They help you visualize a stock’s trajectory over time so you can identify trends and find the best time to buy.
If you’re learning how to read stock charts for the first time, they can seem a little confusing. However, with practice you’ll quickly figure out how to interpret these graphs and use them to inform your investment strategy. Here’s how stock charts work and what to keep in mind when reading them.
What Are Stock Charts?
Stock charts are graphs that illustrate the price of a stock over time. Learning how to read stock charts can help you assess a stock’s performance and evaluate whether it’s a viable investment.
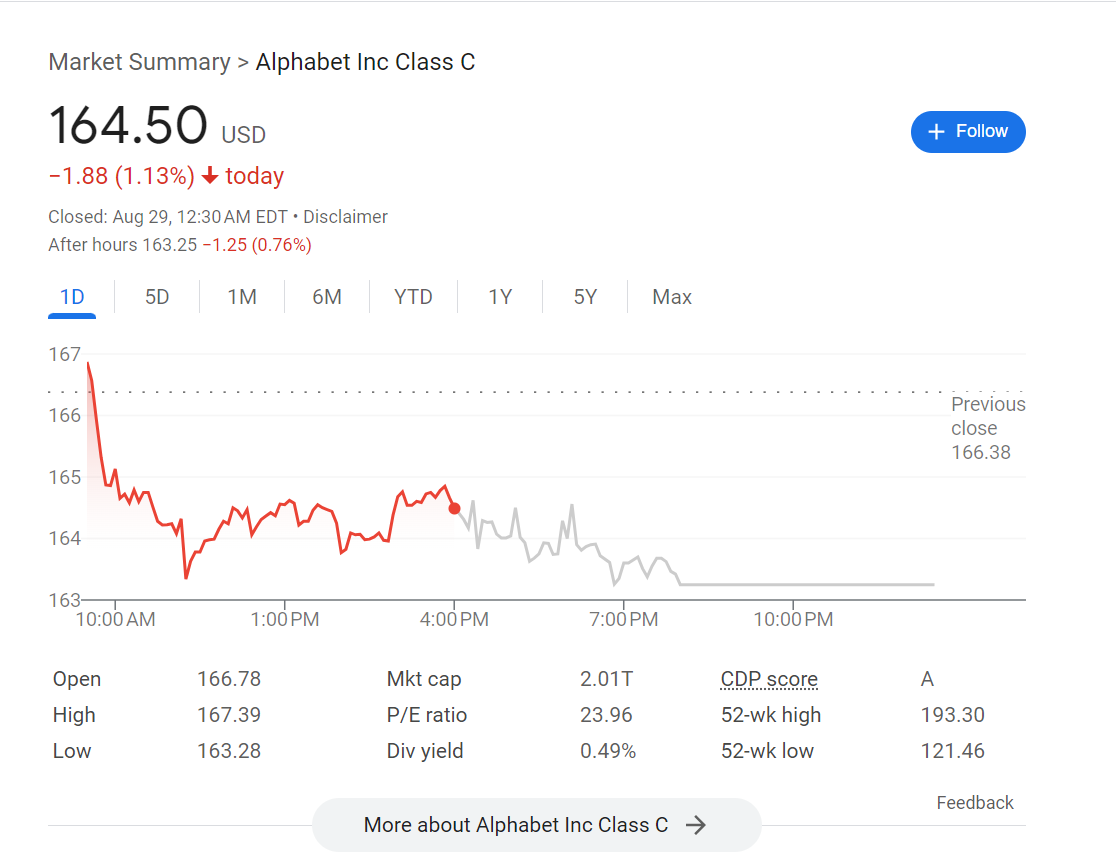
Stock charts typically display time on the X-axis (horizontal line) and the price on the Y-axis (vertical line), with the current price displayed at the top. These digital charts can measure the stock’s trajectory over different time intervals — anywhere from a single day to five years or more.
Beneath the graph, the chart typically displays other key pieces of information, such as the stock’s open price for the day, its 52-week highs and lows, and its highs and lows in the time frame measured.
Other key details you may notice include the stock’s price-to-earnings ratio, dividend yield, and market cap. We’ll define these terms and explain how understanding these metrics can help you a little later.
Similar charts are used to track the progress of mutual funds and even alternative investments.
Source: Google
Why Learn How to Read Stock Charts?
Learning how to read stock charts is an important skill for any beginning investor. These charts provide important data about a stock’s recent performance, which can help you determine whether a stock is trending upward or downward.
Additionally, reading stock charts for beginners provides a variety of other helpful data points that can help you make investing decisions. For example, the stock’s market cap and price-to-earnings ratio can help you assess the company’s perceived value.
Stock charts are just one way to evaluate a potential investment. They should be combined with further research about the company, including its competitors and the industry it operates in, for a more holistic look at the stock’s potential.
How to Read Stock Charts?
Stock charts provide a lot of valuable information about potential investments. Once you’ve learned how to read them, they’re an effective way to learn about a stock at a glance so you can make investment decisions quickly.
Here’s what you need to know about reading stock charts for beginners.
Where to Find Stock Charts?
You can find stock charts in many different places online. The easiest place to find basic stock charts is on Google, as the search engine has built-in stock charts for publicly traded companies. You can simply type the company name into Google followed by the word “stock” to see the current chart.
If you’re looking for more detailed charts than the options available on Google, there are several platforms specifically dedicated to stock charts. A couple of the most popular options are TradingView and StockCharts.com.
Source: Axiory
Types of Stock Charts
The most common type of stock chart is a line chart, pictured for Google in the first image above. This displays the stock’s price in a line that moves up and down as the stock price changes. This type of stock chart is ideal for investing for beginners, as it’s very straightforward and easy to read. They’re used on Google as well as on popular investing apps like Robinhood, which we cover in our Robinhood review.
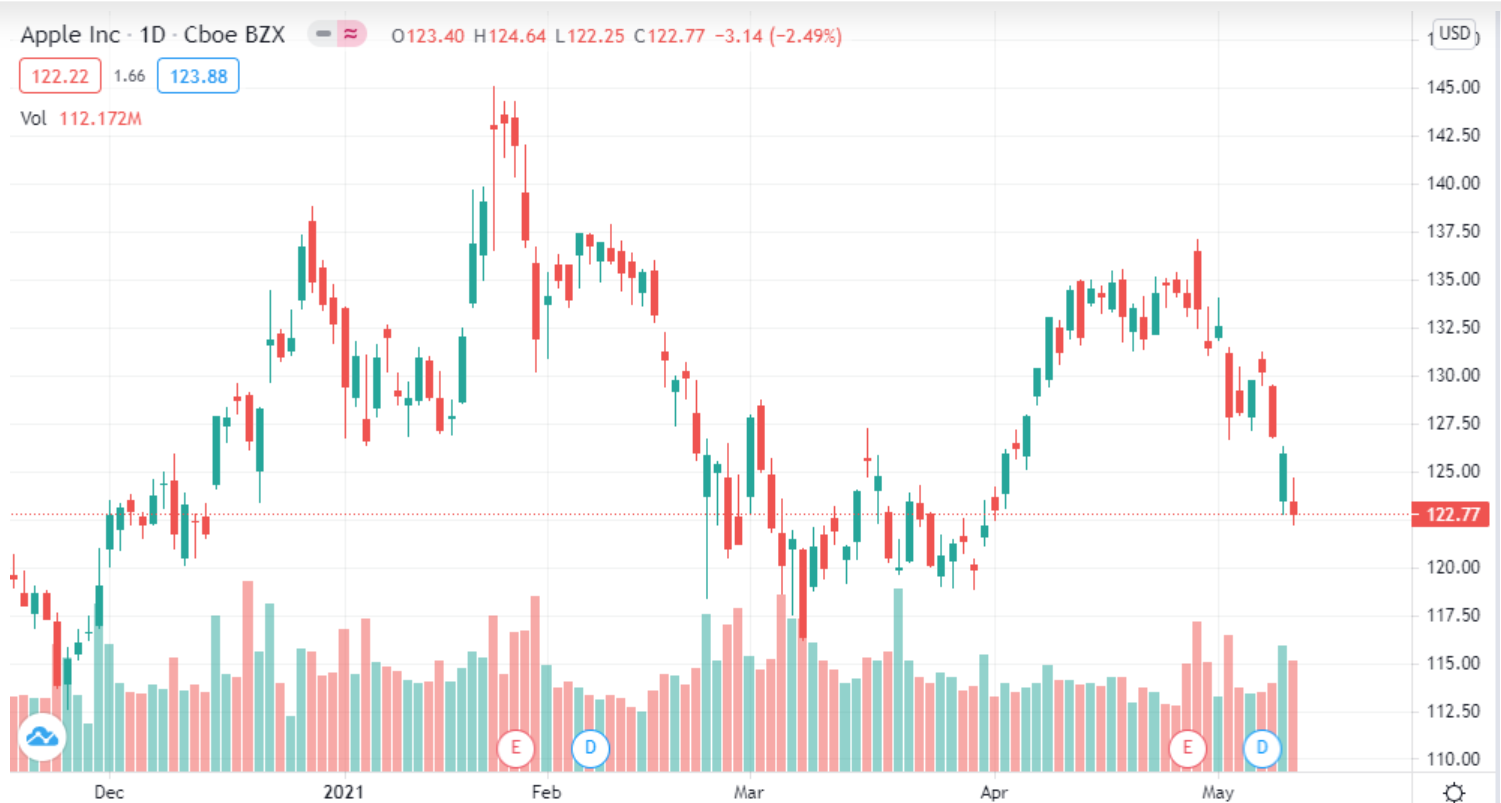
Another popular type of stock chart is the candlestick chart, pictured above for Apple. It looks similar to a line chart at first glance, but it has several small bars, or “candles,” that represent each day the stock was on the market. The ends of each candle indicates the stock’s high point and low point for that day. These charts are slightly more difficult to read, but they provide more detail about which way a stock is trending.
Stock Chart Terminology
You’ll see several financial terms while reading stock charts. Here’s a look at some of the most common stock chart terms.
- Open: The stock’s price at the beginning of the day, when the stock market opens.
- High: The stock’s highest price during a specific time period.
- Close: The stock’s price at the end of the day, when the stock market closes.
- Market cap: Short for market capitalization, this indicates the total dollar value of a company’s outstanding stock shares.
- Dividend yield: This is the amount the company pays annually in dividends.
- P/E ratio: Short for price-to-earnings ratio, this compares the company’s current stock price to its most recent earnings report.
- Support and resistance levels: A support level is the price where a stock tends to stop falling when it’s trending downward, while a resistance level is the price where a stock tends to stop growing when it’s trending upward. Some advanced stock charts identify these levels for you.
Stock Charts and Your Investment Strategy
Once you learn how to read stock charts, you can use them to inform your investment strategy. Stock charts can help you identify stocks that are trending upward but have yet to reach their full potential. Alternatively, these charts are an easy way to monitor the performance of stocks you’ve already invested in, so you can decide when to sell or even when to invest more.
Stock charts will show you how a stock has trended over time, which can help you determine when to invest or if you should sell. In particular, it can be helpful to look at a stock’s historic support and resistance levels. If a stock is reaching its support level, it could be a good time to buy, and if it’s reaching its resistance level, selling could be the right move to maximize your profits.
One particularly helpful data point is a company’s P/E ratio. If the company has a low P/E ratio, that indicates that the price is relatively low given the company’s recent performance. Many investors like to focus on companies with a low P/E ratio, as it indicates room to grow moving forward.
There’s no one best way to invest money, but stock charts can help you make decisions that work for you. Of course, stock charts should be paired with other research about the company, including competitor and industry research, for additional support.
Commonly Asked Questions About How to Read Stock Charts for Beginners
How to Read Stock Charts for Beginners?
A stock chart tracks a particular stock’s progress over time. The top of the chart will display the stock’s current price. You’ll be able to select the time period you want to focus on. Time period options usually include one day, one week, one month, six months, year-to-date, one year, and five years. However, some stock charts include additional time frames to measure.
The X-axis of the chart (horizontal line) measures time intervals, while the Y-axis (vertical line) measures the stock price. The lines on the chart show the stock’s fluctuation over time.
What Types of Stock Charts Are There?
While learning how to read stock charts, you’ll find a few different types.The most common is a line chart, which displays the stock’s progression as a straight line. Another popular type of stock chart is the candlestick chart, which combines features of a line graph and a bar graph. Each “candle” indicates whether the stock is moving up or down relative to its price at open that day.
Where Can I Find Stock Charts Online?
There are many places to find stock charts online for free. Google has a built-in stock charts feature, which is very helpful for reading stock charts for beginners. When you search for a publicly traded company and the word “stock,” its stock chart will appear.
Many finance websites also have free and paid stock charts available online. These include StockCharts.com, TradingView, Yahoo Finance, and more. These platforms offer more advanced stock charting options that are helpful for experienced investors.
Is It Important for Stock Investors to Read Stock Charts?
Investors should know how to read stock charts, even if they’re just learning how to invest in stocks and beginning to build their portfolios. Stock charts are one of the most efficient ways to get information about the stocks you’re interested in and their current prices.